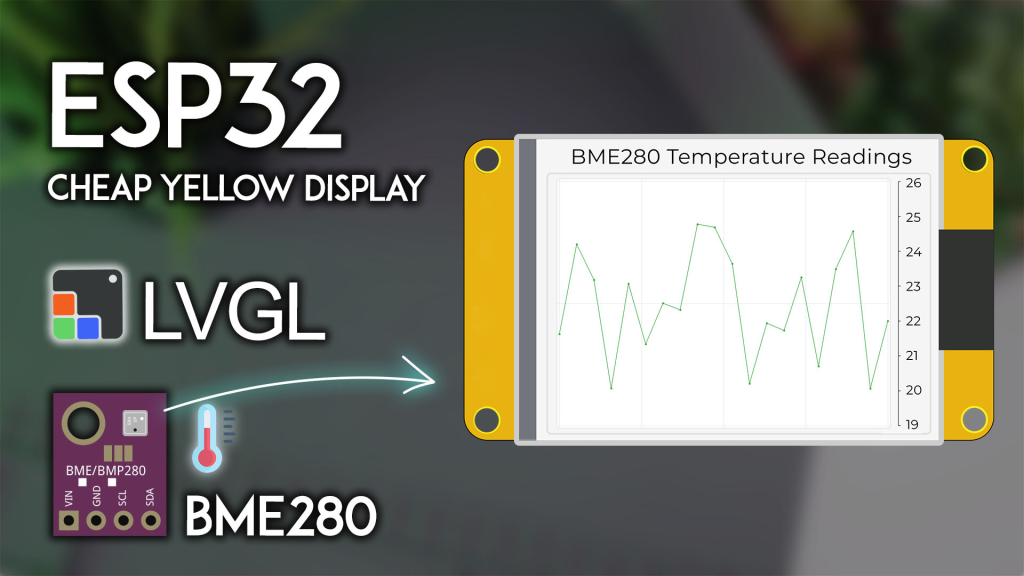
Want to visualize sensor data in a professional, interactive way on your ESP32 Cheap Yellow Display (CYD) ? In this project, you’ll learn how to create a dynamic line chart using LVGL that displays temperature readings from a BME280 sensor. The chart automatically scales, updates in real-time, and even lets you touch data points to see exact values—perfect for environmental monitoring, data logging, or any project where you need to track trends visually.
Project Overview: What You’ll Build
This project combines the power of the ESP32 CYD, the accuracy of the BME280 sensor, and the graphical capabilities of LVGL to create a self-updating temperature chart. Here’s how it works:
-
Real-time data plotting: The chart displays the last 20 temperature readings
-
Auto-scaling Y-axis: The vertical range adjusts automatically based on your current data
-
Circular buffer: When a new reading arrives, the oldest point is removed
-
Touch interaction: Tap near any data point to see its precise temperature value
-
10-second updates: New readings are taken and displayed every 10 seconds
This project is an excellent foundation for creating weather stations, industrial monitors, or any data visualization dashboard.
What You’ll Need: Complete Parts List
Before starting, gather these components:
👉 Find all components at the best prices here
Wiring the BME280 to CYD
The CYD board includes a CN1 connector (JST) that provides access to additional GPIOs. Connect your BME280 sensor as follows:
Note: If your CYD didn’t come with the mating JST connector, you can solder wires directly to the CN1 header pins or use a breadboard with jumper wires.
Prerequisites: Setting Up Your Environment
To ensure your project compiles and runs correctly, complete these essential setup steps in order:
1. ESP32 Board Support in Arduino IDE
If you haven’t already, install ESP32 board support: Installing ESP32 Board in Arduino IDE.
2. Get Familiar with the CYD
First-time CYD user? Complete our Getting Started with ESP32 CYD guide. You’ll need to:
3. Install LVGL for CYD
This project uses LVGL 9.x for the chart interface. Follow our dedicated tutorial to install and configure LVGL properly:
👉 LVGL with ESP32 Cheap Yellow Display
⚠️ CRITICAL: You must use the exact lv_conf.h file provided in that tutorial. Other configurations will not work with this example.
4. Install BME280 Libraries
Install the Adafruit BME280 library and its dependencies:
-
In Arduino IDE: Sketch > Include Library > Manage Libraries
-
Search for “Adafruit BME280” and install the latest version
-
Install any prompted dependencies (Adafruit Bus IO, Adafruit Unified Sensor)
5. (Optional) Touchscreen Calibration
For the most accurate touch interaction with data points, we recommend calibrating your touchscreen. This ensures that tapping a data point reliably selects it. Follow our ESP32 CYD Touchscreen Calibration Guide to get your specific calibration coefficients.
Complete Code: Temperature Line Chart on CYD
Copy the following code into your Arduino IDE. You must replace the placeholder touch calibration values with your own from the calibration guide (or comment out the advanced calibration and use the basic map() method).
ESP32 CYD with LVGL - Dynamic Temperature Line Chart (BME280)
Complete tutorial: https://RandomNerdTutorials.com/esp32-cyd-lvgl-line-chart/
*********/
#include <lvgl.h>
#include <TFT_eSPI.h>
#include <XPT2046_Touchscreen.h>
#include <Wire.h>
#include <Adafruit_Sensor.h>
#include <Adafruit_BME280.h>
#define I2C_SDA 27
#define I2C_SCL 22
TwoWire I2CBME = TwoWire(0);
Adafruit_BME280 bme;
#define TEMP_CELSIUS 1
#define BME_NUM_READINGS 20
float bme_last_readings[BME_NUM_READINGS] = {0};
#define XPT2046_IRQ 36
#define XPT2046_MOSI 32
#define XPT2046_MISO 39
#define XPT2046_CLK 25
#define XPT2046_CS 33
SPIClass touchscreenSPI = SPIClass(VSPI);
XPT2046_Touchscreen touchscreen(XPT2046_CS, XPT2046_IRQ);
#define SCREEN_WIDTH 240
#define SCREEN_HEIGHT 320
int touchX, touchY, touchZ;
#define DRAW_BUF_SIZE (SCREEN_WIDTH * SCREEN_HEIGHT / 10 * (LV_COLOR_DEPTH / 8))
uint32_t draw_buf[DRAW_BUF_SIZE / 4];
unsigned long previousMillis = 0;
const long interval = 10000;
void log_print(lv_log_level_t level, const char * buf) {
LV_UNUSED(level);
Serial.println(buf);
Serial.flush();
}
void touchscreen_read(lv_indev_t * indev, lv_indev_data_t * data) {
if(touchscreen.tirqTouched() && touchscreen.touched()) {
TS_Point p = touchscreen.getPoint();
float alpha_x = -0.000;
float beta_x = 0.090;
float delta_x = -33.771;
float alpha_y = 0.066;
float beta_y = 0.000;
float delta_y = -14.632;
touchX = alpha_y * p.x + beta_y * p.y + delta_y;
touchX = constrain(touchX, 0, SCREEN_WIDTH - 1);
touchY = alpha_x * p.x + beta_x * p.y + delta_x;
touchY = constrain(touchY, 0, SCREEN_HEIGHT - 1);
touchZ = p.z;
data->state = LV_INDEV_STATE_PRESSED;
data->point.x = touchX;
data->point.y = touchY;
} else {
data->state = LV_INDEV_STATE_RELEASED;
}
}
static void chart_draw_label_cb(lv_event_t * e) {
lv_event_code_t code = lv_event_get_code(e);
lv_obj_t * chart = (lv_obj_t*) lv_event_get_target(e);
if(code == LV_EVENT_VALUE_CHANGED) {
lv_obj_invalidate(chart);
}
if(code == LV_EVENT_REFR_EXT_DRAW_SIZE) {
int32_t * s = (int32_t*)lv_event_get_param(e);
*s = LV_MAX(*s, 20);
}
else if(code == LV_EVENT_DRAW_POST_END) {
int32_t id = lv_chart_get_pressed_point(chart);
if(id == LV_CHART_POINT_NONE) return;
lv_chart_series_t * ser = lv_chart_get_series_next(chart, NULL);
while(ser) {
lv_point_t p;
lv_chart_get_point_pos_by_id(chart, ser, id, &p);
int32_t * y_array = lv_chart_get_y_array(chart, ser);
int32_t value = y_array[id];
char buf[32];
const char * unit = TEMP_CELSIUS ? "\u00B0C" : "\u00B0F";
lv_snprintf(buf, sizeof(buf), " %3.1f%s ", bme_last_readings[id], unit);
lv_draw_rect_dsc_t draw_rect_dsc;
lv_draw_rect_dsc_init(&draw_rect_dsc);
draw_rect_dsc.bg_color = lv_color_black();
draw_rect_dsc.bg_opa = LV_OPA_60;
draw_rect_dsc.radius = 2;
lv_area_t a;
a.x1 = chart->coords.x1 + p.x - 35;
a.x2 = chart->coords.x1 + p.x + 35;
a.y1 = chart->coords.y1 + p.y - 30;
a.y2 = chart->coords.y1 + p.y - 10;
lv_layer_t * layer = lv_event_get_layer(e);
lv_draw_rect(layer, &draw_rect_dsc, &a);
lv_draw_label_dsc_t draw_label_dsc;
lv_draw_label_dsc_init(&draw_label_dsc);
draw_label_dsc.color = lv_color_white();
draw_label_dsc.text = buf;
draw_label_dsc.text_local = true;
lv_draw_label(layer, &draw_label_dsc, &a);
ser = lv_chart_get_series_next(chart, ser);
}
}
else if(code == LV_EVENT_RELEASED) {
lv_obj_invalidate(chart);
}
}
lv_obj_t * chart;
lv_chart_series_t * ser_temp;
void create_chart_ui() {
lv_obj_clean(lv_scr_act());
lv_obj_t * label = lv_label_create(lv_screen_active());
lv_label_set_text(label, "BME280 Temperature");
lv_obj_align(label, LV_ALIGN_TOP_MID, 0, 10);
chart = lv_chart_create(lv_screen_active());
lv_obj_set_size(chart, 280, 200);
lv_obj_align(chart, LV_ALIGN_CENTER, 0, 10);
lv_chart_set_type(chart, LV_CHART_TYPE_LINE);
lv_chart_set_div_line_count(chart, 3, 5);
lv_chart_set_range(chart, LV_CHART_AXIS_PRIMARY_Y, 0, 100);
lv_obj_set_style_line_width(chart, 2, LV_PART_ITEMS);
ser_temp = lv_chart_add_series(chart, lv_palette_main(LV_PALETTE_RED), LV_CHART_AXIS_PRIMARY_Y);
lv_chart_set_ext_y_array(chart, ser_temp, (lv_coord_t*)bme_last_readings);
lv_obj_add_event_cb(chart, chart_draw_label_cb, LV_EVENT_ALL, NULL);
}
void initBME() {
I2CBME.begin(I2C_SDA, I2C_SCL, 100000);
if (!bme.begin(0x76, &I2CBME)) {
Serial.println("BME280 not found! Check wiring.");
while (1);
}
Serial.println("BME280 initialized.");
}
float readTemperature() {
float temp = bme.readTemperature();
#if !TEMP_CELSIUS
temp = temp * 9.0 / 5.0 + 32.0;
#endif
return temp;
}
void updateChart() {
for (int i = 0; i < BME_NUM_READINGS - 1; i++) {
bme_last_readings[i] = bme_last_readings[i + 1];
}
float newTemp = readTemperature();
bme_last_readings[BME_NUM_READINGS - 1] = newTemp;
float minTemp = bme_last_readings[0];
float maxTemp = bme_last_readings[0];
for (int i = 1; i < BME_NUM_READINGS; i++) {
if (bme_last_readings[i] < minTemp) minTemp = bme_last_readings[i];
if (bme_last_readings[i] > maxTemp) maxTemp = bme_last_readings[i];
}
minTemp -= 1.0;
maxTemp += 1.0;
lv_chart_set_range(chart, LV_CHART_AXIS_PRIMARY_Y, (lv_coord_t)minTemp, (lv_coord_t)maxTemp);
lv_chart_set_ext_y_array(chart, ser_temp, (lv_coord_t*)bme_last_readings);
lv_chart_refresh(chart);
}
void setup() {
Serial.begin(115200);
Serial.println("ESP32 CYD LVGL Line Chart Starting...");
initBME();
touchscreenSPI.begin(XPT2046_CLK, XPT2046_MISO, XPT2046_MOSI, XPT2046_CS);
touchscreen.begin(touchscreenSPI);
touchscreen.setRotation(1);
lv_init();
lv_log_register_print_cb(log_print);
lv_display_t * disp = lv_tft_espi_create(SCREEN_WIDTH, SCREEN_HEIGHT, draw_buf, sizeof(draw_buf));
lv_display_set_rotation(disp, LV_DISPLAY_ROTATION_270);
lv_indev_t * indev = lv_indev_create();
lv_indev_set_type(indev, LV_INDEV_TYPE_POINTER);
lv_indev_set_read_cb(indev, touchscreen_read);
create_chart_ui();
for (int i = 0; i < BME_NUM_READINGS; i++) {
updateChart();
}
Serial.println("Ready. Chart updates every 10 seconds.");
}
void loop() {
unsigned long currentMillis = millis();
if (currentMillis - previousMillis >= interval) {
previousMillis = currentMillis;
updateChart();
Serial.printf("New temperature: %.2f\n", bme_last_readings[BME_NUM_READINGS - 1]);
}
lv_task_handler();
lv_tick_inc(5);
delay(5);
}
Understanding the Key Parts
1. BME280 Initialization and Reading
The sensor connects via I2C on pins GPIO 27 (SDA) and GPIO 22 (SCL). The initBME() function establishes communication, and readTemperature() returns the current temperature in your chosen unit.
2. Chart Data Management
The bme_last_readings array acts as a circular buffer holding 20 readings. When updateChart() is called:
-
All values shift left (oldest discarded)
-
New reading is added at the end
-
The Y-axis range recalculates based on current min/max values
-
The chart refreshes to show updated data
3. Touch Interaction
The chart_draw_label_cb() function handles touch events on the chart:
-
Detects which data point was touched
-
Draws a black label with the exact temperature value
-
Automatically cleans up when touch is released
This makes it easy to inspect individual readings without clutter.
4. Touchscreen Calibration
The code includes two methods for touch:
For best results, complete the touchscreen calibration tutorial and replace the placeholder coefficients.
Testing Your Temperature Chart
-
Upload the code to your ESP32 CYD
-
Open Serial Monitor (115200 baud) to see debug output
-
Observe the chart—it should start plotting temperature readings every 10 seconds
-
Touch any data point on the line—a label appears showing the exact temperature
If the chart doesn’t update or touch doesn’t work:
-
Verify BME280 wiring (SDA→27, SCL→22)
-
Check that you’ve installed LVGL and TFT_eSPI with the correct configuration files
-
Try the basic touch mapping if advanced calibration seems off
Taking It Further: Project Enhancements
This foundation opens many possibilities:
Add Humidity or Pressure
The BME280 also measures humidity and pressure. Create additional chart series to display all three simultaneously.
Log Data to SD Card
The CYD has a microSD slot. Save all readings with timestamps for later analysis.
Add Wi-Fi Upload
Send temperature data to a web server, database, or IoT platform like Blynk or ThingSpeak.
Create Historical Views
Add buttons to switch between different time scales (last hour, last day, etc.).
Add Alerts
Trigger the RGB LED or a sounder if temperature exceeds a threshold.
Where to Buy Components
Ready to build your own temperature chart? Here are the parts you’ll need:
👉 Check all components and best prices here
Conclusion
You’ve just built a professional-quality real-time temperature chart on the ESP32 Cheap Yellow Display using LVGL. This project demonstrates:
-
Dynamic data visualization with auto-scaling axes
-
Touch interaction for precise value inspection
-
Sensor integration with the popular BME280
-
Real-time updates with circular buffer management
This same pattern can visualize any time-series data—stock prices, signal strength, air quality, or machine performance. The ESP32 CYD and LVGL make it surprisingly easy to create polished, interactive displays for your projects.
Get your components today and start visualizing your data!
Contact Us