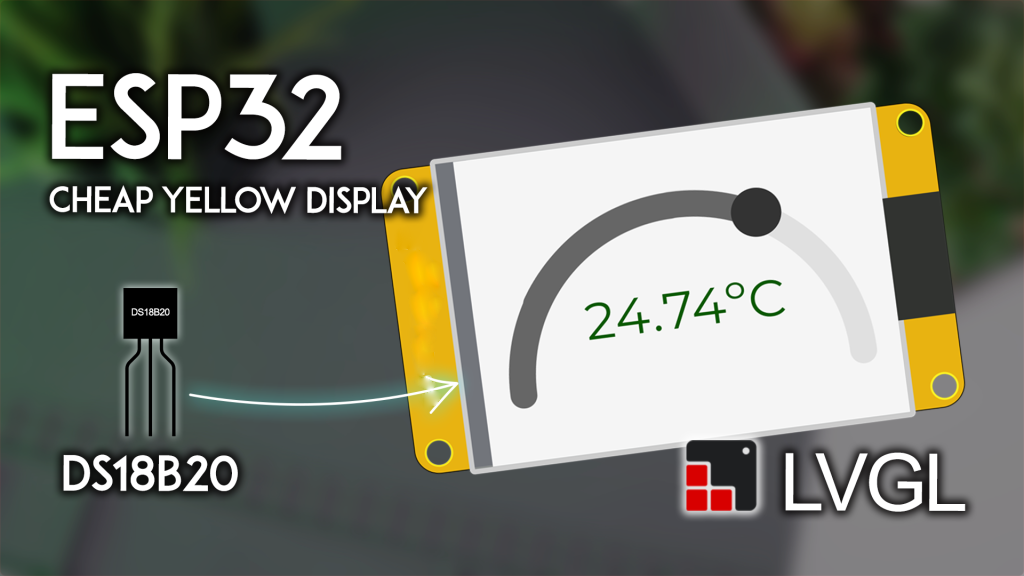
Looking to build a sleek, real-time temperature monitor with a visual gauge for your workshop, greenhouse, or smart home? Combining the incredibly popular ESP32 Cheap Yellow Display (CYD) with a DS18B20 temperature sensor and the powerful LVGL graphics library is the perfect solution.
This step-by-step guide, updated for 2026, will show you exactly how to create a professional-looking interface that displays temperature readings on a text label and a dynamic, color-changing curved gauge. You’ll learn how to style LVGL objects, read sensor data accurately, and have a fully functional project running in under an hour.
Whether you’re a maker building a climate control system or a hobbyist learning IoT displays, this guide provides the tested code and wiring instructions you need to succeed—without the usual library headaches.
Why This Project? Understanding the Value for Your Purchases
Before we dive into the code, it’s worth understanding why this specific combination of hardware and software is a smart investment for your project toolkit.
-
The ESP32 CYD (ESP32-2432S028R) : For around $15, you get an ESP32 development board with a built-in 2.8-inch touchscreen, microSD slot, and RGB LED. It’s arguably the best value display board for IoT projects.
-
The DS18B20 Sensor: This waterproof, digital temperature sensor is incredibly accurate and uses the simple OneWire protocol, meaning it only requires one GPIO pin. It’s perfect for remote sensing. You can find genuine DS18B20 sensors here.
-
LVGL: This open-source graphics library is the industry standard for embedded GUIs. Learning it now allows you to build far more complex interfaces later—think touch buttons, animations, and dashboards.
Ready to build? Let’s get started.
Prerequisites: The Foundation for Success (Read Carefully)
To ensure your project compiles and runs without errors, you must follow these setup steps precisely. Using incorrect library configurations is the #1 reason projects fail.
1. Hardware You’ll Need
-
ESP32 CYD Board (ESP32-2432S028R)
-
DS18B20 Temperature Sensor (TO-92 package or waterproof version)
-
4.7k Ohm Resistor (for the sensor’s data line)
-
Jumper wires and a breadboard, or the JST connector that came with your CYD.
-
Micro USB Cable (for power and programming).
2. Software Setup: The “Must-Do” Steps
You will program the ESP32 using the Arduino IDE. Complete these tutorials in order:
-
Install ESP32 Boards: Follow our guide to add ESP32 support to your Arduino IDE: [Install ESP32 Boards in Arduino IDE].
-
Get to Know Your CYD: Understanding the pinout is critical. Start with our [Getting Started with ESP32 CYD Board] guide.
-
Install and Configure LVGL & TFT_eSPI: This is the most important step. LVGL (version 9.2 by kisvegabor) and TFT_eSPI require specific configuration files (lv_conf.h and User_Setup.h) to work with the CYD.
-
Install DS18B20 Libraries: You’ll need two libraries from the Library Manager: OneWire by Paul Stoffregen and DallasTemperature by Miles Burton.
Wiring the DS18B20 to Your CYD
The DS18B20 uses the OneWire protocol, which requires a single data line and a pull-up resistor.
-
Connection Point: The CYD has a CN1 connector (often with a small JST pigtail) that breaks out several GPIO pins. We’ll use GPIO 27 for the data pin.
-
Circuit:
-
Connect the DS18B20 VDD (red) pin to the CYD’s 3.3V pin.
-
Connect the DS18B20 GND (black/blue) pin to the CYD’s GND pin.
-
Connect the DS18B20 DATA (yellow/white) pin to the CYD’s GPIO 27.
-
Connect a 4.7k Ohm resistor between the DATA pin and the 3.3V pin (this is the pull-up resistor).
(You can refer to the detailed CYD Pinout Guide here for exact pin locations.)
The Complete Arduino Code: Temperature on Text & Arc
Create a new Arduino sketch and paste the code below. After pasting, you’ll need to select your temperature unit and ensure your libraries are correctly configured as per the prerequisites.
Complete guide at: https://RandomNerdTutorials.com/esp32-cyd-lvgl-temperature-ds18b20/
This example displays DS18B20 temperature on a CYD screen using LVGL.
Temperature is shown on a text label (with color change) and an arc gauge.
*/
#include <lvgl.h>
#include <TFT_eSPI.h>
#include <OneWire.h>
#include <DallasTemperature.h>
const int oneWireBus = 27;
OneWire oneWire(oneWireBus);
DallasTemperature sensors(&oneWire);
#define TEMP_CELSIUS 1
#if TEMP_CELSIUS
#define TEMP_ARC_MIN -20
#define TEMP_ARC_MAX 40
#define DEGREE_SYMBOL "\u00B0C"
#else
#define TEMP_ARC_MIN -4
#define TEMP_ARC_MAX 104
#define DEGREE_SYMBOL "\u00B0F"
#endif
#define SCREEN_WIDTH 240
#define SCREEN_HEIGHT 320
#define DRAW_BUF_SIZE (SCREEN_WIDTH * SCREEN_HEIGHT / 10 * (LV_COLOR_DEPTH / 8))
uint32_t draw_buf[DRAW_BUF_SIZE / 4];
void log_print(lv_log_level_t level, const char * buf) {
LV_UNUSED(level);
Serial.println(buf);
Serial.flush();
}
lv_obj_t * arc;
static void set_temp(void * text_label_temp_value, int32_t v) {
sensors.requestTemperatures();
float ds18b20_temp;
#if TEMP_CELSIUS
ds18b20_temp = sensors.getTempCByIndex(0);
#else
ds18b20_temp = sensors.getTempFByIndex(0);
#endif
#if TEMP_CELSIUS
float cold_threshold = 10.0;
float hot_threshold = 29.0;
#else
float cold_threshold = 50.0;
float hot_threshold = 84.2;
#endif
if(ds18b20_temp <= cold_threshold) {
lv_obj_set_style_text_color((lv_obj_t*) text_label_temp_value, lv_palette_main(LV_PALETTE_BLUE), 0);
}
else if (ds18b20_temp > cold_threshold && ds18b20_temp <= hot_threshold) {
lv_obj_set_style_text_color((lv_obj_t*) text_label_temp_value, lv_palette_main(LV_PALETTE_GREEN), 0);
}
else {
lv_obj_set_style_text_color((lv_obj_t*) text_label_temp_value, lv_palette_main(LV_PALETTE_RED), 0);
}
int arc_value = map((int)ds18b20_temp, TEMP_ARC_MIN, TEMP_ARC_MAX, 0, 100);
arc_value = constrain(arc_value, 0, 100);
lv_arc_set_value(arc, arc_value);
String temp_text = String(ds18b20_temp, 1) + DEGREE_SYMBOL;
lv_label_set_text((lv_obj_t*) text_label_temp_value, temp_text.c_str());
Serial.print("Temperature: ");
Serial.println(temp_text);
}
void lv_create_main_gui(void) {
arc = lv_arc_create(lv_screen_active());
lv_obj_set_size(arc, 210, 210);
lv_arc_set_rotation(arc, 135);
lv_arc_set_bg_angles(arc, 0, 270);
lv_obj_set_style_arc_color(arc, lv_color_hex(0x666666), LV_PART_INDICATOR);
lv_obj_set_style_bg_color(arc, lv_color_hex(0x333333), LV_PART_KNOB);
lv_obj_align(arc, LV_ALIGN_CENTER, 0, 10);
lv_obj_t * text_label_temp_value = lv_label_create(lv_screen_active());
lv_label_set_text(text_label_temp_value, "--.-");
lv_obj_align(text_label_temp_value, LV_ALIGN_CENTER, 0, 10);
static lv_style_t style_temp;
lv_style_init(&style_temp);
lv_style_set_text_font(&style_temp, &lv_font_montserrat_32);
lv_obj_add_style(text_label_temp_value, &style_temp, 0);
lv_anim_t a_temp;
lv_anim_init(&a_temp);
lv_anim_set_exec_cb(&a_temp, set_temp);
lv_anim_set_duration(&a_temp, 2000);
lv_anim_set_playback_duration(&a_temp, 2000);
lv_anim_set_var(&a_temp, text_label_temp_value);
lv_anim_set_values(&a_temp, 0, 100);
lv_anim_set_repeat_count(&a_temp, LV_ANIM_REPEAT_INFINITE);
lv_anim_start(&a_temp);
}
void setup() {
Serial.begin(115200);
Serial.println("ESP32 CYD DS18B20 Temperature Monitor Starting...");
sensors.begin();
lv_init();
lv_log_register_print_cb(log_print);
lv_display_t * disp;
disp = lv_tft_espi_create(SCREEN_WIDTH, SCREEN_HEIGHT, draw_buf, sizeof(draw_buf));
lv_display_set_rotation(disp, LV_DISPLAY_ROTATION_270);
lv_create_main_gui();
Serial.println("Setup Complete. GUI Running.");
}
void loop() {
lv_task_handler();
lv_tick_inc(5);
delay(5);
}
How the Code Works: A Quick Breakdown
Understanding the code will help you customize it for your own projects.
-
Sensor Reading: The sensors.requestTemperatures() and sensors.getTempCByIndex(0) functions (from the DallasTemperature library) handle all the OneWire communication to get a clean temperature value.
-
Unit Selection: The #define TEMP_CELSIUS 1 line is a simple switch. Change it to 0 and re-upload to display Fahrenheit. The gauge range and degree symbol update automatically thanks to the #if TEMP_CELSIUS ... #else ... #endif preprocessor directives.
-
Dynamic Styling: Inside the set_temp() function, lv_obj_set_style_text_color() is used to change the label’s color based on simple if statements comparing the temperature to thresholds. This creates an intuitive visual alert system.
-
The Arc Gauge: The lv_arc object is created and styled. Its value is set using lv_arc_set_value(). Note the map() function converts the temperature range (e.g., -20 to 40) to the arc’s internal range (0 to 100).
-
Animation for Updates: Instead of using delay() in the loop(), which would freeze the GUI, we use an LVGL animation. lv_anim_set_exec_cb(&a_temp, set_temp) tells LVGL to call our set_temp() function every 2 seconds (lv_anim_set_duration(&a_temp, 2000)). This is the professional way to handle periodic tasks in a GUI.
Testing Your Temperature Monitor
-
Verify Your Files: Ensure you have the custom lv_conf.h and User_Setup.h files in the correct locations as per the setup guide.
-
Select Board and Port: In Arduino IDE, go to Tools > Board and select ESP32 Dev Module. Then select the correct COM Port.
-
Upload: Click the upload button. Open the Serial Monitor (set to 115200 baud) to see debug output.
-
See the Result: After uploading, your CYD screen should show a gray arc and a temperature reading in the center. The text color will be blue, green, or red based on the temperature. Touch the sensor to see the value and gauge move!
(Image: Your CYD displaying the temperature on the arc gauge)
Troubleshooting Common Issues
-
Screen is Blank or White: This is 99% a library configuration issue. Revisit the CYD LVGL Setup Guide and ensure you’ve replaced the default lv_conf.h and User_Setup.h files with the ones provided.
-
Temperature Reads -127°C or 85°C: This is the sensor’s “error” value.
-
Text or Gauge Not Updating: The animation might not be starting. Check the Serial Monitor for any LVGL error logs. Ensure you haven’t added a long delay() somewhere in your code, as this will block LVGL.
-
Brownout Errors: If your ESP32 resets repeatedly, your power source may be weak. Use a good quality USB cable and a USB port that can supply sufficient current.
Taking Your CYD Projects Further
You’ve just built a core component of any environmental monitoring system. This same principle can be extended to:
-
Multi-Sensor Dashboard: Add a DHT22 for humidity and display both values.
-
Smart Thermostat Controller: Add touch buttons to set a target temperature and control a relay.
-
Data Logger: Use the CYD‘s microSD card slot to log temperature readings over time.
If you’re ready to move from single sensors to complete, connected home automation systems, our eBook “Build a Home Automation System for Beginners” guides you through using the ESP32, LVGL, and Node-RED to create a professional, Wi-Fi-enabled control panel.
Conclusion: Your First Step into Professional IoT GUIs
Congratulations! You’ve successfully built a smart, visually appealing temperature monitor. You’ve not only learned how to read a sensor but also mastered essential LVGL techniques like creating arcs, dynamic styling, and using animations—skills that form the foundation for any sophisticated embedded GUI project.
The ESP32 CYD is an unbeatable platform for learning and prototyping. Now go ahead and experiment—change the colors, add a second sensor, or design a new layout. The possibilities are endless.
Contact Us